Zabbix plugin
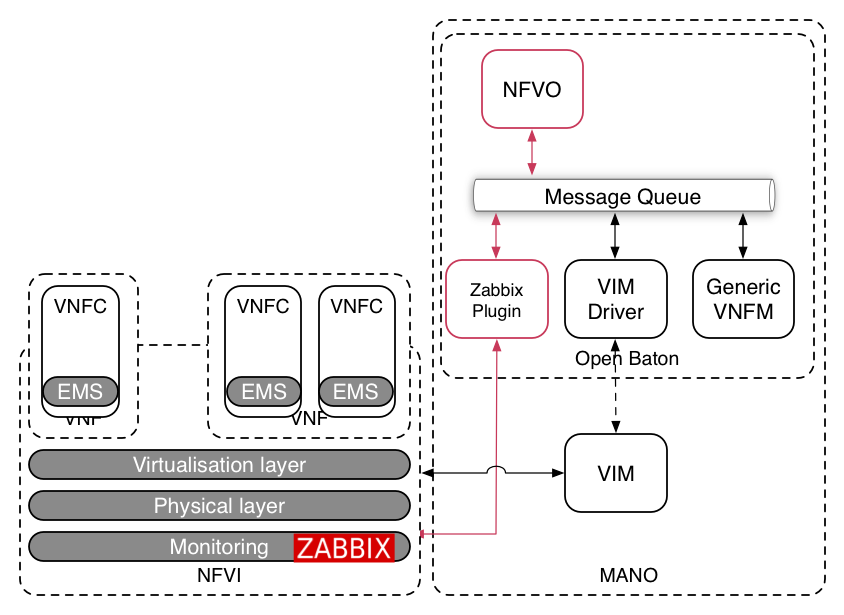
Zabbix plugin (see it on GitHub) is an open source project providing a reference implementation of two interfaces of the VIM, based on the ETSI NFV MANO specification.
The two interfaces are:
- VirtualisedResourceFaultManagement
- VirtualisedResourcePerformanceManagement
A detailed description of the interfaces is in the ETSI IFA005_Or-Vi_ref_point_Spec.
In particular with the Zabbix plugin you can create/delete items, trigger and action on-demand.
Some of the benefits introduced by the usage of such plugin:
1) Make the consumers (NFVO, VNF managers, Fault Management System, AutoScaling Engine) independent to the monitoring system.
2) The communication between the consumers and Zabbix Plugin is JSON based, so the consumers can be written in any languages.
3) The values of the items are cached and updated periodically in order to avoid to contact the Zabbix Server each time a specific metric is required.
Prerequisites
The prerequisites are:
- Zabbix server (2.2 or 3.0) installed and running. See how to configure Zabbix server 2.2 or Zabbix server 3.0.
- Open Baton NFVO up and running
- Git installed
Set up environment
Create and give the right permissions to the folder which will host the configuration file:
sudo mkdir -p /etc/openbaton
sudo chwon -R $USER: /etc/openbaton
The Zabbix Plugin logs at default in the file /var/log/openbaton/openbaton-plugin-monitoring-zabbix.log. Create and give the right permissions in that folder running the command:
sudo mkdir -p /var/log/openbaton
sudo chwon -R $USER: /var/log/openbaton
Installation
Once the prerequisites are met, you can clone the following project from git, compile it using gradle and launch it:
git clone https://github.com/openbaton/zabbix-plugin.git
cd zabbix-plugin
./gradlew build -x test
Configuration
Once you are inside the zabbix-plugin directory type this command:
cp src/main/resources/plugin.conf.properties /etc/openbaton/openbaton-plugin-monitoring-zabbix.properties
The configuration parameters are explained in the following table.
| Parameter | Description | Default |
|---|---|---|
| zabbix-plugin-ip | IP of the Zabbix Plugin machine | localhost |
| type | The type of the plugin | zabbix-plugin |
| client-request-frequency | Update cache period (Basically each time t, Zabbix Plugin ask to every items value for all hosts and fill the local cache). Set 0 to disable it | 10 (seconds) |
| history-length | How long is the history. If the client-request-frequency is 10 seconds and history-length 100, we have available the value of the items of the previous 1000 seconds. | 250 |
| notification-receiver-server-context | Context where the zabbix-plugin receive the notifications by the zabbix server. (see the section 'How to configure Zabbix to get notifications') | /zabbixplugin/notifications |
| notification-receiver-server-port | Port where the zabbix-plugin receive the notifications by the zabbix server. | 8010 |
| external-properties-file | Full path of the configuration file. | /etc/openbaton/openbaton-plugin-monitoring-zabbix.properties |
| zabbix-host | IP of the Zabbix Server | localhost |
| zabbix-port | Port of the Zabbix Server | |
| user-zbx | User of the Zabbix Server | Admin |
| password-zbx | Password of Zabbix Server | zabbix |
| zabbix-server-version | Zabbix Server version | 3.0 |
The configuration file should look like the one below:
## Zabbix Plugin

zabbix-plugin-ip=localhost
# Set client-request-frequency to 0 to disable the caching
type=zabbix-plugin
client-request-frequency=10
history-length=250
notification-receiver-server-context=/zabbixplugin/notifications
notification-receiver-server-port=8010
external-properties-file=/etc/openbaton/openbaton-plugin-monitoring-zabbix.properties

## Zabbix Server info

zabbix-host=localhost
# zabbix-port=
user-zbx=Admin
password-zbx=zabbix
# Supported Zabbix versions: 2.2 and 3.0
zabbix-server-version=3.0
Additional Zabbix Server configuration required for receiving notifications
If you are going to use Open Baton FM system or you wish to use the createThreshold method, you need this additional configuration.
Create a script called "send_notification.sh" with the following content.
#!/bin/bash
to=$1
body=$3
curl -X POST -H "Accept: application/json" -H "Content-Type: application/json" -d "$body" http://$to
The variable 'to' is the endpoint where zabbix-plugin receives the notification (specified in notification-receiver-server-context property).
Copy the following script in the Zabbix Server machine. In particular, in a special directory defined in the Zabbix Server configuration file (/etc/zabbix/zabbix_server.conf) as AlertScriptsPath variable. If the value of the variable AlertScriptsPath is for example "/usr/lib/zabbix/alertscripts",
then copy the send_notification.sh script just created in that folder.
Once you are in the directory "/usr/lib/zabbix/alertscripts", add executable permissions to the script running the command:
sudo chmod +x send_notification.sh
Note: when you will use the method createThreshold, Zabbix Plugin will configure Zabbix Server automatically in order to use the script "send_notification.sh". What it will try to do is the configuration at this page custom alertscripts. If for any reason this auto-configuration won't work, you will see in the Zabbix Plugin logs, then you should execute this configuration manually as explained in the Zabbix documentation.
Run the Zabbix Plugin
Simply run the jar with:
java -jar build/lib/openbaton-plugin-monitoring-zabbix-<version>.jar
Check the logs in /var/log/openbaton/openbaton-plugin-monitoring-zabbix.log
Notification mechanism
How does Zabbix plugin receive notifications from the Zabbix Server?
When using the method createThreshold provided by the plugin, it automatically creates an action executed when the specific condition is met. If the threshold is crossed (the status of the trigger goes from OK to PROBLEM or viceversa) the action is performed. The action gets the informations of the threshold and sends them to a custom alertScript. The custom alertscripts is executed on the Zabbix Server and its task is to send the information received from the action to the Zabbix plugin.
Zabbix plugin waits for notifications at the url: http://zabbix-plugin-ip:defaultPort/defaultContext.
Default context and ports are specified in the configuration file as: notification-receiver-server-context. notification-receiver-server-port.
Using it via MonitoringPluginCaller
In order to use the MonitorPluginCaller you need to import the relative plugin-sdk, coming from Openbaton project. To import the plugin-sdk, please add in your Gradle file the following dependencies:
repositories {
       maven { url 'https://oss.sonatype.org/content/repositories/snapshots/' }
       maven { url 'https://oss.sonatype.org/content/repositories/releases/'  }
}

dependencies {
    compile 'org.openbaton:monitoring:4.0.0'
}
Then in your main, obtain the MonitoringPluginCaller as follows:
MonitoringPluginCaller monitoringPluginCaller = null;
    try {
      monitoringPluginCaller =
          new MonitoringPluginCaller(
              rabbitmqIp,
              rabbitmqUsr,
              rabbitmqPwd,
              5672,
              "zabbix-plugin",
              "zabbix",
              "15672",
              120000);
    } catch (Exception e) {
      e.printStackTrace();
    }
Make sure to use the correct arguments' values. A description is provided in the following:
| Argument value | Description |
|---|---|
| rabbitmqIp | IP of RabbitMQ (broker) |
| rabbitmqUsr | Username for RabbitMQ |
| rabbitmqPwd | Password for RabbitMQ |
| 5672 | RabbitMQ default port (change it if needed) |
| zabbix-plugin | Type of the Monitoring Plugin |
| zabbix | Name of the Monitoring Plugin |
| 15672 | RabbitMQ default management port |
| 120000 | Timeout of the calls on the MonitoringPluginCaller |
Functionalities provided by the Zabbix Plugin Interface
VirtualisedResourcePerformanceManagement interface
| Methods | Description |
|---|---|
| CREATE PM JOB | Create one or more items to be monitored in one or more hosts. |
| DELETE PM JOB | Delete a PM job. |
| QUERY PM JOB | Get item values from one or more host. Fast method since the item values are cached. |
| SUBSCRIBE | Subscribe to a pm job or a threshold in order to be notified. |
| NOTIFY | Notification method invoked by zabbix plugin, the customer must not invoke directly this method. |
| CREATE THRESHOLD | Create trigger on a specific item for one or more hosts |
| DELETE THRESHOLD | Delete a threshold. |
| QUERY THRESHOLD | Get information about the status of the thresholds |
VirtualisedResourceFaultManagement interface
| Methods | Description |
|---|---|
| SUBSCRIBE | Subscribe for alarm coming from an host |
| NOTIFY | Notification method invoked by zabbix plugin, the customer must not invoke directly this method. |
| GET ALARM LIST | Get alarms and relative status |
VirtualisedResourcePerformanceManagement interface
Create PM Job
String createPMJob(ObjectSelection selector, List<String> performanceMetrics, List<String> performanceMetricGroup, Integer collectionPeriod,Integer reportingPeriod) throws MonitoringException;
This method create one or more items to be monitored in one or more hosts.
selector: object to select the hosts in which we want to add the items.
performanceMetrics: List of items. We can create items which are available in the Zabbix documentation 2.2 or Zabbix documentation 3.0.
performanceMetricGroup: pre-defined list of metrics. (NOT YET IMPLEMENTED, please pass an empty list of string).
collectionPeriod: Update interval of the item/s in seconds.
reportingPeriod: Specifies the periodicity at which the VIM will report to the customers about performance information. (NOT YET IMPLEMENTED, please pass an integer >= 0 ).
In the following example we create two items ('net.tcp.listen[8080]' and 'agent.ping') for two hosts ('host-1' and 'host-2'). As a return value we get the ID of the PMJob.
ObjectSelection objectSelection = getObjectSelector("host-1","host-2");
List<String> performanceMetrics = getPerformanceMetrics("net.tcp.listen[8080]","agent.ping");
String pmJobId = monitoringPluginCaller.createPMJob(objectSelection, performanceMetrics, new ArrayList<String>(),60, 0);
System.out.println("PmJobId is: "+pmJobId);
Here the methods getObjectSelector and getPerformanceMetrics:
private List<String> getPerformanceMetrics(String ... performanceMetrics) {
    List<String> result = new ArrayList<String>();
    for(String performanceMetric : performanceMetrics){
        result.add(performanceMetric);
    }
    return result;
}

private ObjectSelection getObjectSelector(String ... hosts) {
    ObjectSelection objectSelection = new ObjectSelection();
    for(String host : hosts){
        objectSelection.addObjectInstanceId(host);
    }
    return objectSelection;
}
Delete Pm Job
List<String> deletePMJob(List<String> pmJobIdsToDelete) throws MonitoringException;
This method delete an existing PmJob. We can get the id of the PmJob after the creation with createPMJob. As a return value we get the ID of the PMJobs effectively deleted.
Query Pm Job
List<Item> queryPMJob(List<String> hostnames, List<String> performanceMetrics, String period) throws MonitoringException;
This method get item values from one or more host. As a return value we get the list of items.
hostnames: list of hostnames which we want to know items values.
performanceMetrics: List of items. We can get items which are available in: the Zabbix documentation 2.2, Zabbix documentation 3.0, and in the hostnames.
period: period in seconds. If period is 0 than you get the last available value of the item. If > 0 you get the average of the values inside that period. Remember than the zabbix-plugin read all value of the all hosts every client-request-frequency (see the configuration section) and keep them in the history. So if client-request-frequency is 15 seconds and the period 30 seconds you get the average of the previous 2 values of the item.
In the following example we ask for the last value of two items ('net.tcp.listen[8080]' and 'agent.ping') for the hosts 'host-1'.
ArrayList<String> hostnames = getHostnames("host-1");
ArrayList<String> performanceMetrics = getPerformanceMetrics("net.tcp.listen[8080]","agent.ping");
List<Item> items = monitoringPluginCaller.queryPMJob(hostnames,performanceMetrics,"0");
items: list of items. An item is a simple object of openbaton-libs which contains properties like: metric, hostname, lastValue, value.
Subscribe & notifyInfo
NOT YET IMPLEMENTED
Create Threshold
String createThreshold(ObjectSelection selector, String performanceMetric, ThresholdType thresholdType, ThresholdDetails thresholdDetails) throws MonitoringException;
This method create a trigger on a specific item for one or more hosts. As a return value we get the id of the threshold.
selector: object to select the hosts which will be part of the trigger.
performanceMetric: item to include in the trigger. The item need to be already present in the hosts specified in the selector.
thresholdType: defines the type of threshold. (NOT YET IMPLEMENTED, please pass ThresholdType.SINGLE for the moment).
thresholdDetails: details of the threshold. It contains:
- function: refer to Zabbix trigger function 2.2 or Zabbix trigger function 3.0
- triggerOperator: operator
- perceiverSeverity: severity of the trigger.
- value: threshold value to compare with the actual value of the performanceMetric.
- hostOperator: can be "|" or "&", meaning that the threshold will trigger when at least one host or all the hosts cross the threshold value.
In the following example we create a treshold for two hosts ('host-1' and 'host-2').
ObjectSelection objectSelector = getObjectSelector("host-1","host-2");
ThresholdDetails thresholdDetails= new ThresholdDetails("last(0)","=",PerceivedSeverity.CRITICAL,"0","|");
String thresholdId = zabbixMonitoringAgent.createThreshold(objectSelector,"net.tcp.listen[5001]",ThresholdType.SINGLE_VALUE,thresholdDetails);
The trigger that will be created has this expression: {host-1:net.tcp.listen[5001].last(0)}=0|{host-2:net.tcp.listen[5001].last(0)}=0. It means that if host-1 OR host-2 have no more process listening on the port 5001 then create an alarm with severity critical. Refer to Zabbix expression 2.2 or Zabbix expression 3.0 to understand better the expression.
Delete Threshold
List<String> deleteThreshold(List<String> thresholdIds) throws MonitoringException;
This method delete an existing threshold/s. We can get the id of the threshold after the creation with createThreshold. As a return value we get the list of the ID of the threshold effectively deleted.
Query Threshold
NOT YET IMPLEMENTED
VirtualisedResourceFaultManagement interface
Subscribe
String subscribeForFault(AlarmEndpoint filter) throws MonitoringException;
Subscribe for alarm generated by thresholds. As a return value we get the id of the subscription. filter: AlarmEndpoint object which contains: - name: name of the alarmEndpoint. - resourceId: hostname which we want to subscribe. - type: REST or JMS. - endpoint: endpoint where we want to be notified. It is and url for REST or a queue name for JMS. (actually only rest is supported). - perceivedSeverity: define the severity of the alarm we want to get. If we specify PerceivedSeverity.WARNING we will able to get notification from alarm with severity equals or higher than WARNING.
In the following example we subscribe for all alarms with severity higher than WARNING coming from the host 'host-1'.
AlarmEndpoint alarmEndpoint = new AlarmEndpoint("fault-manager-of-host-1","host-1",EndpointType.REST,"http://localhost:5555/alarm",PerceivedSeverity.WARNING);
String subscriptionId = monitoringPluginCaller.subscribeForFault(alarmEndpoint);
Unsubscribe
String unsubscribeForFault(String subscriptionId) throws MonitoringException;
This method detele the subscription with the ID passed as a argument. As a return value we get the id of the subscription effectively deleted. We can get the id of the subscription after the creation with subscribeForFault.
Get alarm list
NOT YET IMPLEMENTED
Notify
This method cannot be invoked by the customers as specified in the ETSI draft IFA005_Or-Vi_ref_point_Spec.
Zabbix severity mapping with ETSI severity
In Zabbix we can specify a severity of a trigger: not classified, information, warning, average, high, disaster.
In the ETSI draft there are different level of severity, called perceived severity: Indeterminate, warning, minor, major, critical.
So the mapping in the zabbix plugin is showed in the following table:
| Zabbix severity | ETSI perceived severity |
|---|---|
| Not classified | Indeterminate |
| Information | Warning |
| Warning | Warning |
| Average | Minor |
| High | Major |
| Disaster | Critical |
Notifications types
When we create a new threshold, we would like to get a notification as soon as the threshold is crossed. Both interfaces send notifications with the method notify. According to ETSI specification there are 4 types of notifications.
The interface VirtualisedResourcePerformanceManagement sends two types of notifications:
- PerformanceInformationAvailableNotification (NOT YET IMPLEMENTED) : this notification informs the receiver that performance information is available.
- hresholdCrossedNotification (NOT YET IMPLEMENTED) : his notification informs the receiver that a threshold value has been crossed.
The interface VirtualisedResourceFaultManagement sends the following notifications:
- AlarmNotification: This notification informs the receiver of alarms resulting from the faults related to the virtualised resources managed by the VIM. It contains the Alarm with all the information about the fault.
- AlarmStateChangedNotification: This notification informs the receiver of state change of alarm related to the virtualised resources managed by the VIM, e.g. the alarm shall be set to “cleared” if the corresponding fault has been solved. It contains the id of the Alarm and the actual status which could be (CLEARED,FIRED,UPDATED).
Actually the zabbix-plugin when receives the notification by zabbix server, if the trigger has severity higher than Information, it creates an alarm (mapping zabbix notification into standard Alarm) and notify the subscribers with a AlarmNotification. If the notification is not new, then it sends an AlarmStateChangedNotification.